Monitoring methods
There are a range of methods that can be used to monitor air pollutants. Each method has advantages and disadvantages. Regardless of the method, all data should be subject to robust quality assurance and control.
Monitoring
Air quality is monitored for the following reasons:
-
Public information:
It allows local residents to identify current air pollution levels and air pollution trends in their local areas. -
Policy development:
It allows local authorities to identify local air pollution hotspots and to drive local policies to address air pollution in those areas. -
Research needs:
It provides useful data for the development of air quality research and for the validation of air quality models. -
Compliance:
It allows regulating bodies and members of the public check if air quality standards and objectives are being achieved. -
Air quality trends:
It allows trends in air quality to be assessed to see if pollution levels are improving over time. -
Validating air pollution models:
It allows air quality dispersions models to be check and calibrated to ensure they provide a realistic representation of the real world. -
National and local air quality management:
It allows air quality to be regularly reviewed at both a national and local level plans to be made to manage air quality. -
Evidence based approaches:
Measuring air pollution before and after an intervention can help decide if the intervention is working or if it needs to change.
Methods
In Lewisham, air pollution is officially monitored and reported at about 350 locations. Three monitoring techniques (automatic monitoring, passive monitoring and air quality sensors) are used by the local authorities in Lewisham to monitor air quality at those locations.
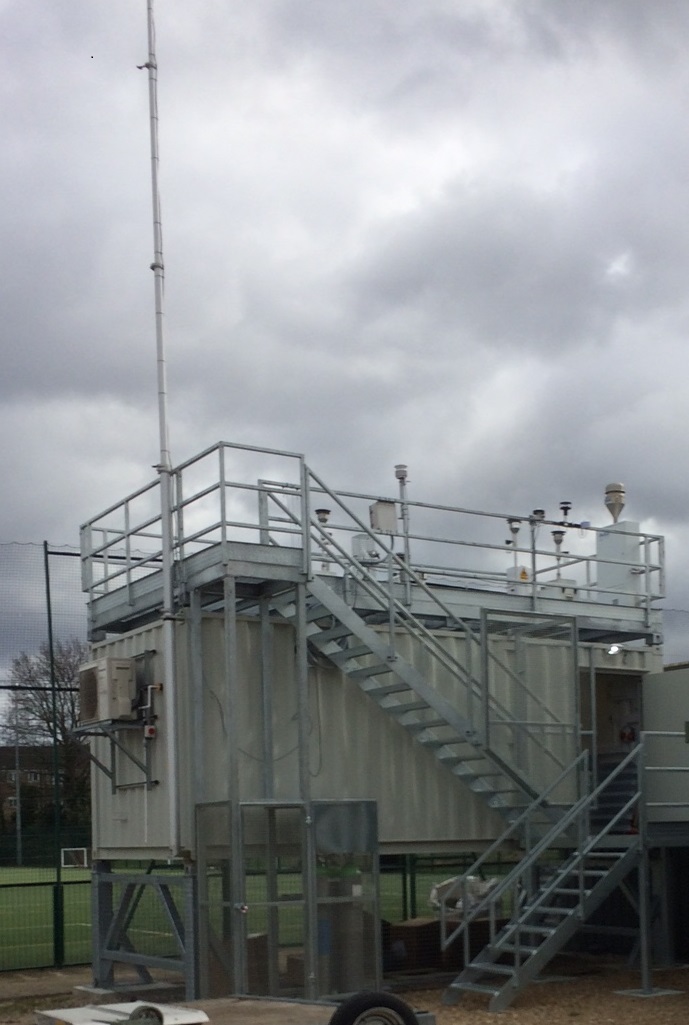
Automatic monitoring
Automatic air quality monitoring stations (automatic monitors) typically produce hourly measurements which can be viewed by anyone in near to real-time. The data is corrected, maintained, and calibrated regularly to ensure data is accurate and reliable. Automatic monitors draw in ambient air and measure the concentration of the pollutant in the sampled air. In Lewisham there are currently five automatic monitoring sites, they all measure nitrogen dioxide. Two also measure particulates (PM10 and PM2.5), and one also measures ozone (O3).
Advantages
- High resolution data
- Data reported on air quality websites near real-time
- Monitor pollutants 24 hours a day
- It allows to identify daily trends and the impacts of short-term pollution episodes
Disadvantages
- Expensive
- Regular trained operator maintenence required
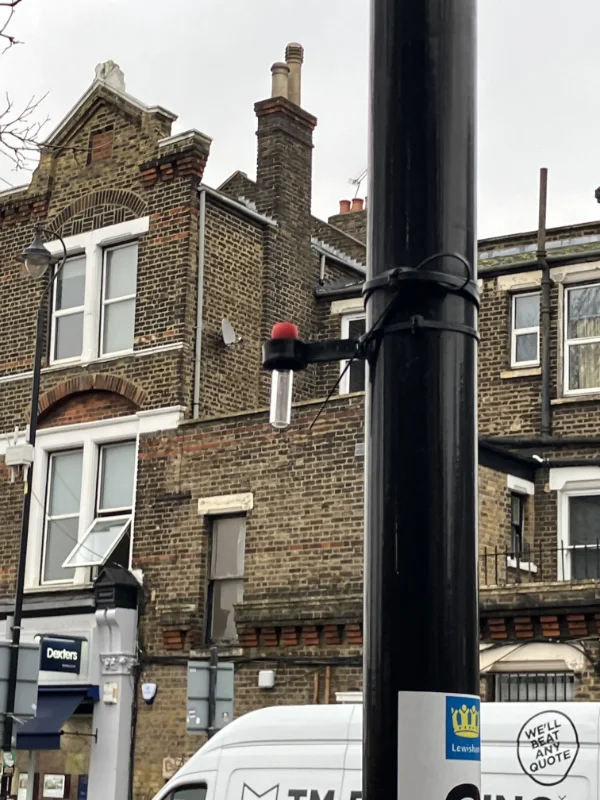
Passive Sampling
Passive sampling using ‘Diffusion tubes’ offer a simple and cost-effective method of monitoring to give a good general indication of average pollution concentrations.
Lewisham currently has 156 Diffusion tubes set up around the area collecting data, the latest data is available on the map on the home page.
Advantages
- Low cost and simple
- Useful for screening and base-line studies.
- In support of automatic monitoring for detailed assessments
Disadvantages
- Unproven for some pollutants
- Laboratory analysis required
- Only provide weekly or longer averages in general.
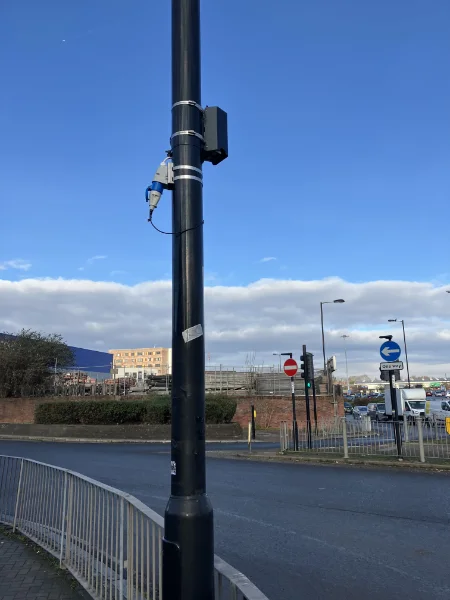
Sensor monitoring
Sensor monitors offer a simple and cost-effective method of monitoring to give a good general indication of average pollution concentrations.
They are typically battery powered and can be used at fixed locations (e.g. attached to a lamppost) or handheld for mobile pollution studies.
They can provide very highly time resolved data – 1 minute average or less – and because of the lower costs can be deployed in larger numbers than conventional automatic analysers.
Lewisham have six sensors set up in strategic locations to measure the impact of local initiatives to reduce Woodburning in the area. The live data can be seen on the map on the home page.
Advantages
- Lower cost and simple to use
- Can be used as a portable sensor
- Can run on either mains or solar power
Disadvantages
- Not as accurate as other monitoring methods
Measurements and annual statistics
The Lewisham data selector contains options for you to retrieve data (measurements and simple statistics) relating to air quality across Lewisham from 1994 to today.
There are two types of monitoring data available within the Lewisham Air Quality Network. The statistics in the database are calculated from theses measurements.

Automatic monitors
Measure hourly pollutant concentrations from a continuous stream of air pumped through the analysers. Data are collected each day by modem from the analysers storing the information at each site. The data goes back as far as 1994 from the monitoring sites accessible using the data selector below.

Non automatic monitors
Tube exposure is measured passively on a monthly basis. Samples are collected by chemical reaction on a substrate within the tube and then sent off to a laboratory for analysis. Final pollutant concentrations are calculated from these results.
Data selector
The Data selector tool allows you to access measurement data and simple statistics for both automatic monitors and diffusion tube monitors across Lewisham.